
Assignment 1: Halftoning
Due date: Wednesday, May 27th, 2015
Summary
Digital halftoning refers to algorithms that can approximate continuous-toned (i.e., greyscale) images using only pure black marks on a white background (or, more generally, marks of any foreground colour on a contrasting background). This assignment will explore stippling as a halftoning method, while also offering the opportunity for a more open-ended creative bonus exercise.
Question 1: Stippling
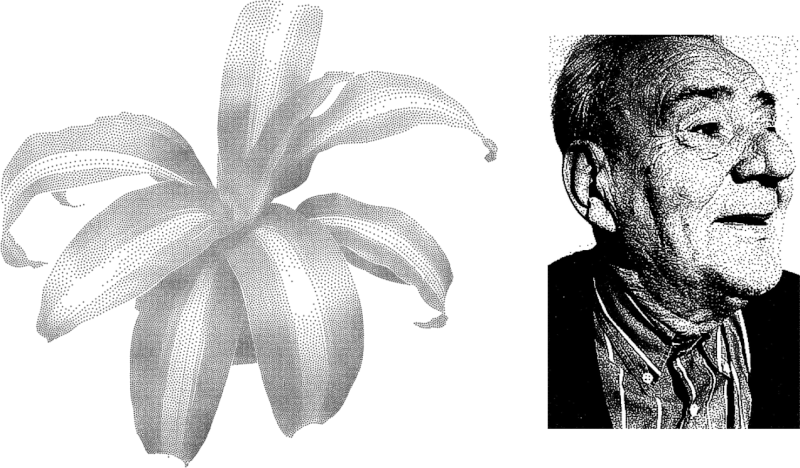
You must implement a self-contained program that can create vector graphic stippled illustrations from greyscale images. You have a choice of implementing one of two algorithms. Weighted Voronoi Stippling (Secord, NPAR 2002) relies on GPU acceleration to run a weighted variant of Lloyd’s method on a set of stipples until they converge on an importance sampling of the source image. Structure-Preserving Stippling (Li and Mould, Graphics Interface 2011) is a kind of error-diffusion dithering process tuned to produce stippled drawings.
Specification
Begin by reading the two papers, at least at a high level. You don’t need to read either paper in full detail in order to complete the assignment: in both cases, Sections 1–3 contain most of the information you need.
Now write a program that implements your preferred stippling algorithm from the two papers above. At the very least, your program should be able to read in a greyscale image, generate a stipple distribution using reasonable default parameters (if necessary) and output a vector graphic illustration of those stipples. Please see “Implementation Notes” below for additional thoughts and tips related to the implementations of these two stippling techniques.
You must also implement at least one non-trivial extension. This part of the assignment is open-ended. Ideally, a non-trivial extension is one that produces a noticeable, qualitative change to the illustrations produced by your system. You should be able to show side-by-side images with and without your extension and convince a stranger that your extension is doing something interesting. (Some extensions are more about performance or interactivity, in which case it might be necessary to demonstrate the change in some other way.)
What follows is a short list of suggestions for extensions. You are free (indeed, encouraged) to dream up other ideas. If you’re unsure about your idea, or need more guidance, come talk to me.
- Move more of the algorithm to the GPU, particularly Weighted Voronoi Stippling. How much of WVS can be run exclusively on the GPU?
- Implement the algorithm so that it can be run interactively from within a web page. There are many opportunities here to use JavaScript, the HTML5 Canvas, on-board cameras, WebGL, and so on.
- For WVS, experiment instead with exact computation of Voronoi diagrams on the CPU. The geometry of the diagram can probably be computed quite quickly using a library like Triangle, but is there a way to overcome the bottleneck and limitations of sampling the source image? Can you demonstrate a noticeable quality difference when using a CPU-based Voronoi computation?
- Implement the postprocessing brushes described by Deussen et al. in the Floating Points paper.
- Experiment with temporally coherent animations of stipples. There are a few previous papers on animating element distributions. Is it possible to create a program that dynamically updates a stippling in response to video camera input?
- Combine the two algorithms: use SPS to generate an initial stipple generation and WVS to refine it.
- Throw in my TSP Art technique on top of the stipple locations. Experiment with local variations to path width to control tone reproduction more accurately.
- Use asymmetric stipples, so that you can see their directionality. Then find a way to orient stipples to help them indicate image gradients as well as tone.
- Explore a new way to get a greater range of stipple density in WVS, or a way to get more blue-noise-like spacing of stipples in SPS.
This part of the assignment is not intended to be overwhelming; it’s just a way to get you thinking about what ideas might follow on from the papers. Don’t feel you have to wear your fingers down to nubs trying to implement your extension. A proof of concept will suffice.
What to submit
You need to produce a short write-up describing your implementation and showcasing the illustrations you created. Your write-up can either be a PDF document or a web page. Your submission should not contain more than about three or four pages of text, though you’re welcome to make it longer by including lots of pictures. Some time before the deadline, email me either a URL for your web-based write-up or a PDF.
You are free to structure your submission as you desire. But it should include at least the following:
- Describe your implementation. What set of languages, tools, and libraries did you use? What is the interface? If you created an interactive user interface, include screen shots.
- If there are aspects of the paper that you didn’t get working, list them. If applicable, explain how you would need to modify your program to complete the implementation.
- Describe your extension. Explain why you predicted your extension would enhance the algorithm’s output. Briefly explain how you had to modify the core algorithm to accommodate this extension. Comment on how successful you feel the extension was.
- Include sample output. Always include the source image along with the illustration. Use at least three different source images. Good judgment matters: choose images that clearly show your implementation’s correctness, and that make for artistic paintings. If you include raster pictures in a web page, be sure also to link to vector drawings (PDF, SVG, or PS). If you’re feeling bold you can embed SVG illustrations directly in your web page. In a PDF report, make sure you include your output as actual vector images, not rasterized (as long as the file doesn’t get too big).
- At least one result must clearly demonstrate the effect of your extension (if your extension can not be demonstrated visually, you must find some other way to prove that it’s working). If possible, give a side-by-side comparison with and without the extension running, highlighting its effect.
- One result must be your official artifact, the one you want to use to represent your submission as a whole (think of this as the image that would go in the “teaser figure” common on the first pages of graphics papers). It can be an additional image or one of the ones above; just make sure it’s clearly indicated. Part of your mark will be based on the artistic merit of this result.
You’re welcome to include other comments and observations on the paper, the technique, and the value of this class of algorithms. I’m also interested in ideas for future work.
By default, I’m not going to look at your source code. But I reserve the right to request it as part of marking if it sounds from your description like there’s something worth taking a look at. I also reserve the right to request a live demonstration; this could be important if you create an especially nice interface or a realtime version of the algorithm.
Implementation notes
Here are some more specific notes to help with the implementation of these two techniques. Each note is labeled with one of “WVS”, “SPS”, or “BOTH” to indicate which technique it will help with.
- (WVS) You need to create an initial stipple distribution for refinement with Lloyd’s method. Just about any technique will work here, but you’ll converge on better results faster if you use an approximation of importance sampling. Adrian uses rejection sampling (generate random points, but don’t add a point if it’s too close to an existing one). You could experiment with stratified sampling or even some form of dithering, but you should be able to control the number of stipples you generate precisely.
- (WVS) Use the hardware acceleration trick for rendering Voronoi diagrams (see in particular the Hoff III reference in the WVS paper). It’s ideal to render the Voronoi diagram to an off-screen buffer, though you may also want the ability to draw the diagram on the screen and/or output it to a file for debugging purposes.
- (SPS) The Li and Mould paper relies on a priority queue data structure, and it’s important to be able to modify the priorities of elements already in the queue dynamically. If you’re using C++, Boost’s
heaplibrary contains a priority queue implementation in which priorities can be modified. But note that with eight-bit greyscale images as used in the paper, there are only 128 possible priorities. It’s probably possible to implement a cheap and fast priority queue using something like 128 linked lists, one for each priority level. - (WVS) In a naive implementation, you will find that your Voronoi stipples will tend to drift towards one corner of the illustration. This tends to happen because you occasionally treat coordinates as being given relative to pixel corners, and sometimes relative to pixel centres. Try offsetting your cone positions by (0.5,0.5).
- (SPS) I’m working on my own solution to the Li and Mould algorithm, which I haven’t attempted before. It’s possible I’ll have more tips to offer here if I get my implementation working to my satisfaction.
- (BOTH) You’ll need some way of reading images. There are many libraries for loading images in specific file formats, depending on your choice of programming language. I often find it easier to standardize on a trivial file format and then use pre-existing tools to convert to and from that format. For greyscale images, have a look at Plain PGM. If you assume the PGM file has no embedded comments, you can write a PGM reader in about 15 lines of C++. Supporting more input formats is convenient, but not necessary.
- (BOTH) You must be able to generate your output in a vector graphics format. The easiest to work with directly are Postscript and SVG (it’s quite useful in computer graphics to build some basic knowledge of how to generate Postscript files). Some programming systems, like Processing, support transparent generation of PDFs by capturing and redirecting built-in graphics API functions.
- (BOTH) Find a way of controlling radii for circular stipples to improve tone reproduction. In the WVS paper, this requires a post-process that measures the tone contained in a Voronoi region and scales the stipple to cover that proportion of the region. The SPS paper describes a formula for computing stipple radii, but also offers one or two alternatives that might be worth exploring.
- (BOTH) If you have tips for languages, libraries, tools, or programming techniques that will be useful to other students in the class, feel free to send them to me before the deadline; I’m happy to share them here.
Bonus: Halftoned art
Create an original real-world artwork based on halftoning. The artwork must be a physical object in which the halftoning is achieved in an interesting way (i.e., you can’t just print out a picture of black primitives on a white page). You can use any medium you want (the weirder the better), but you are restricted to placing objects of a single solid colour on a black background. You are encouraged, but not required, to write a short program that generates the information used to drive the halftoning process.
If you complete the bonus question, please email me a PDF report of at most two pages (or a web page of comparable length) that describes (and names) the work, explains its construction and includes a large image of the artwork. If possible, bring your artwork to class on the day of the assignment deadline.