The artist M.C. Escher drew many lovely tilings, which he called “regular divisions of the plane”. He worked hard to ensure that his tilings were of lifelike animal forms such as birds and fish. He filled notebooks with hand-drawn sketches of tilings, many of which later found their way into his woodcuts. If you’d like a detailed account of these notebooks and their mathematical connections, I recommend Doris Schattschneider’s book Visions of Symmetry; A Google image search is also a quick way to see a lot of the drawings.
One of Escher’s lifelong obsessions was the representation of infinity in a finite work of art. He experimented with several ideas for fitting infinitely many tiles into a drawing, culminating in his famous Circle Limit prints based on hyperbolic geometry. But that’s a story for another day. Before that, he drew a number of tilings where tiles form rings or spirals that diminish towards a point at the centre of the drawing. I call your attention in particular to Fish, Path of Life I, Path of Life III, and Development II. His remarkable final print Snakes executes a cunning transition from a hyperbolic tiling near the edge of a disc to a spiral tiling near the centre. Since then, others have created similar drawings. For example, you’ll see a few in a gallery of images by Jos Leys.
Naturally, mathematicians and computer scientists have worked on techniques for creating new tilings in this style. For example, you can see some abstract spirals emerging in a Bridges paper by Robert Fathauer. It seems to me that there has been an uptick in this sort of work recently—I have been sent a few different scholarly manuscripts on spiral tilings to review for journals. However, these manuscripts go through painful contortions to attempt to express the construction of these tilings in awkward, unnatural ways. It turns out that there’s a beautiful and exceedingly simple idea for turning ordinary planar Escher tilings into spiral tilings, an idea I’d like to share here for anyone interested in pursuing research on this topic. It’s an old idea too—I include it in Section 5.3 of my 2002 PhD dissertation, and I certainly don’t claim to have invented it (more on this later).
Most of the rest of this post will explain the math needed to create spiral tilings. You’ll need to be familiar with some geometry, trigonometry, and the complex numbers. Even if you don’t want to work through the math, be sure to scroll down to the bottom: at the end, I’ll introduce a fun web-based tool I created to let you play around with these tilings yourself!
The Complex Exponential
We’ll start with the exponential function  . Here
  is Euler’s number, approximately 2.71828. The function is standard in modelling situations with rapid growth, like populations of organisms or compound interest.
We can extend the domain of the exponential function to the entire complex plane using standard laws for exponents together with Euler’s formula (Euler has a lot of things named after him!). For a given complex number  , we end up with
![\[f(z) = e^z = e^{a+ib} = e^ae^{ib} = e^a(\cos b + i\sin b)\]](https://isohedral.ca/wp-content/ql-cache/quicklatex.com-e5e4307241b93ea22e34e299c075e564_l3.png "Rendered by QuickLaTeX.com")
In other words, thinking for a moment in terms of regular Cartesian coordinates, a point  will get mapped to a new point
  , which can also be thought of (via polar coordinates) as a point at distance
  from the origin, making a counterclockwise angle of
  with the
  axis. Note that the
  and
and  functions repeat with a period of
  ; therefore, a vertical column of points spaced out by multiples of , like fenceposts seen from above, will all get mapped to the same point by the exponential function. In practice, we might as well factor out this repetition: we can draw pictures by starting with a single horizontal slice of the complex plane of height , and mapping its contents through
  . What will that look like? We can start to get a handle on how images distort by looking at what happens to straight lines:
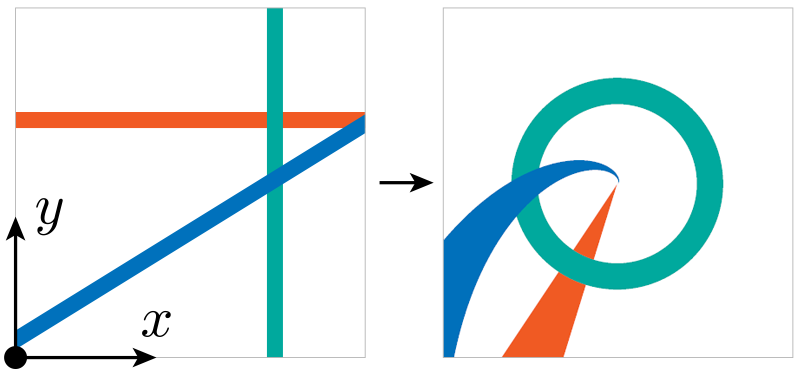
The picture on the left shows a square portion of our horizontal slice of the plane of height , which becomes the picture on the right after mapping through the complex exponential. Let’s consider each of the lines shown on the left.
- Sticking with Cartesian coordinates, the green vertical line consists of points of the form
 for all values of . These get mapped to points of the form
  on the right. Or, letting
  , we end up with the set of points
  for all . In other words, a circle centred on the origin, as shown.
 - On the other hand, the orange horizontal line has a varying
 and a fixed
  , giving
  . The range of the real exponential function is all positive real numbers, so the image of the horizontal line is a radial line extending out from the origin at angle . In our drawing the image of the orange line looks a bit like an infinite “wedge”; that happens because I’m mapping the full thickness of the line, and that thickness gets crammed into a tighter space closer to the origin.
 - General diagonal lines don’t map to simple shapes like lines or circles. It turns out that they become logarithmic spirals, where the slope of the line determines the pitch of the spiral. Logarithmic spirals arise frequently in nature (the Wikipedia page linked here gives some examples).
Public Service Announcement: the so-called golden spiral is a logarithmic spiral whose pitch is related to the golden ratio. But not every logarithmic spiral is golden, and nature doesn’t favour golden spirals. You’ll often see the claim that nautilus shells are related to the golden ratio, but there’s simply no connection; they do grow (approximately) logarithmically, but there’s nothing forcing them to become golden spirals.
Notice also that although this mapping distorts space quite a bit, it does preserve angles: the angle at which two curves cross on the right is the same as the angle between the two original lines on the left. Such mappings are called conformal.
Already we can start to see how patterns of lines that repeat in the plane can be turned into interesting spiral patterns:
In general, as long as the top and bottom edges of the drawing on the left match up seamlessly, the exponential map will turn it into a seamless spiral drawing on the right. The effect is a bit like rolling the horizontal slice up into a tube and then looking down the length of the tube (but not really: things don’t shrink in perspective quite as they do with our mapping here). Looked at another way, if you have a pattern that repeats over the whole plane in some direction, you can rotate and scale the pattern so that the repetition is vertical and has length . Then we know that the edges of the slice will line up.
My introduction to the mapping of patterns through the complex exponential function came from the 1992 paper “Two Conformal Mappings” by Robert Dixon, which I also cited in my dissertation. Dixon gave it the more evocative name “the antiMercator mapping”.
Periodic Tilings
A tiling of the plane is called periodic if there are vectors (i.e., arrows) in two distinct directions along which you can slide the tiling and have it match up with itself exactly when you’re done. For example, if your tiling is an infinite square grid, you can slide it horizontally or vertically by the edge length of a single square, and the tiling will look the same. We can even exploit this fact to make a animated GIF that loops forever:
These vectors are called translational symmetries of the tiling. The nice thing about symmetries is that if you perform several of them in sequence, the result must be a symmetry as well. In this case, if you have a set of vectors that are all translational symmetries, the sum of those vectors is also a symmetry.
To sprinkle in a bit of notation, let’s say you’ve got a periodic tiling, and let  and
and  be two translational symmetries of that tiling, as described above. (We’ll want to assume they’re not parallel, though that’s not strictly required.) Let
  and
and  be two integers, not both zero. Then the new vector
  is a translational symmetry of the tiling.
OK, then, here’s the punchline: we can rotate and scale the whole tiling so that the vector is vertical and has length . That puts the tiling into a configuration where the top and bottom edges of our canonical horizontal stripe line up, meaning that we’ll get a seamless drawing under the complex exponential map!

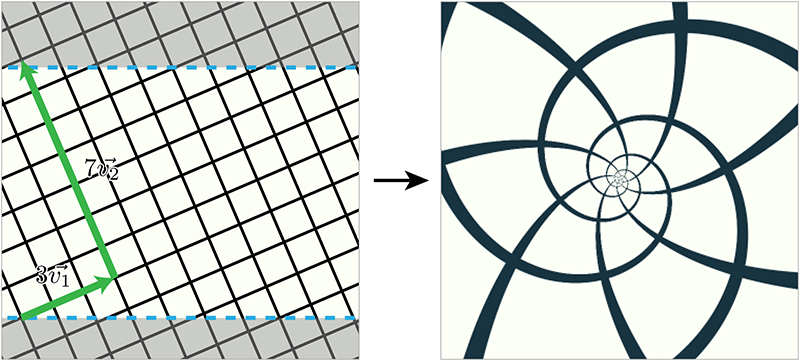
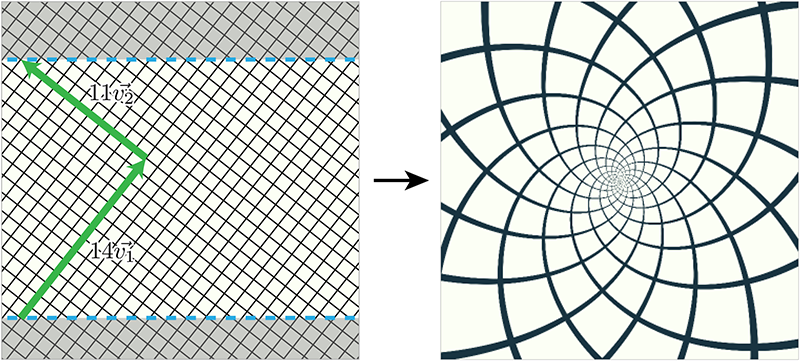
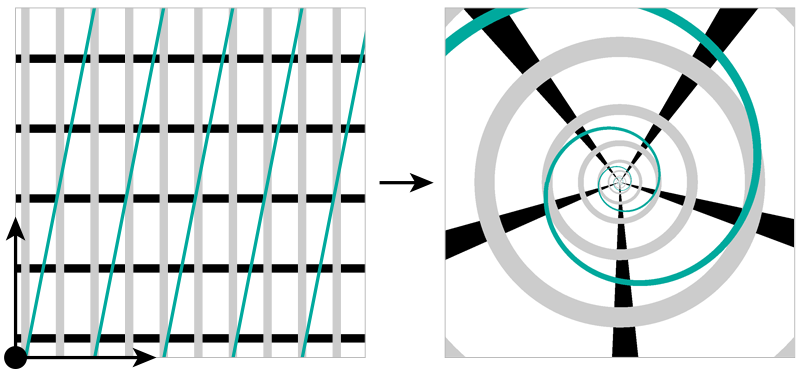
We now have a recipe that we can apply starting from any periodic tiling together with integers and . Let’s look at some examples based on a humble tiling of squares. Unlike the previous diagrams, I’m zooming out a bit to show some of the tiling above and below the slice. The slice itself is bounded by the dashed horizontal lines. You can see that in each case I’m taking a different sum of horizontal and vertical square edges as my primary vertical repeat vector. The whole tiling is then oriented so that this sum of the two green vectors is vertical and has length . Something quite nice happens here. Consider the  tiling, for example. As you walk along any vertical line in the slice, you’ll pass three grid lines parallel to and seven lines parallel to . This fact is reflected in the spiral tiling: if you look carefully, you can see three spirals of tiles in one direction and seven in another! The colourings below allow you to count them up. The pattern holds in general: a spiral square tiling based on will exhibit spiral arms in one direction and in the other.
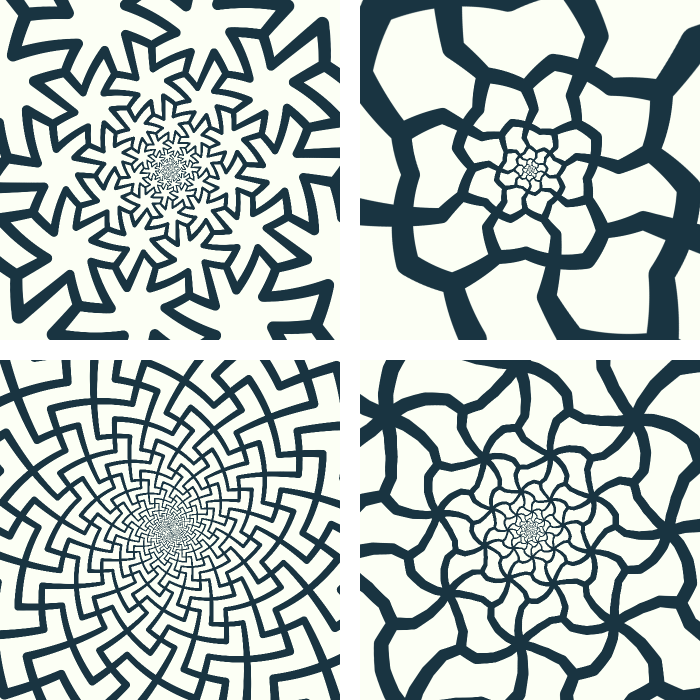
Of course, there’s nothing here that restricts you to squares. Any periodic tiling of the plane can be combined with integers and and mapped into one of these spiral arrangements. Here are just a couple of examples; can you figure out the tiling and the values of and that were used to produce them? Note that I’m restricting myself here to simple geometric tilings, but this technique would work exactly the same on fancy Escher-like tilings with varying colours, internal details, and other artistic devices.

As I said, the idea of using the complex exponential function (AKA the antiMercator mapping) to produce drawings like these is far from new. The specific application to periodic tilings shown here isn’t new either, given that it appears in my dissertation from (gulp) more than 15 years ago. I don’t know of an earlier source for this small novelty, but I absolutely don’t think I came up with it myself. In fact, I believe it may have been the great tiling theorist Branko Grünbaum who pointed it out to me in person. I had the good fortune to interact with him while I was working on my PhD, and everything I’ve shown you here would have been immediately obvious to him.
Two Infinities Are Better Than One
I have one more trick up my sleeve. We can pass the spiral tiling through a different function of the complex plane called a Möbius transformation, a function of the form
![\[f(z) = \frac{az+b}{cz+d}\]](https://isohedral.ca/wp-content/ql-cache/quicklatex.com-3e14392b0118773d8e52e3d9b26806d6_l3.png "Rendered by QuickLaTeX.com")
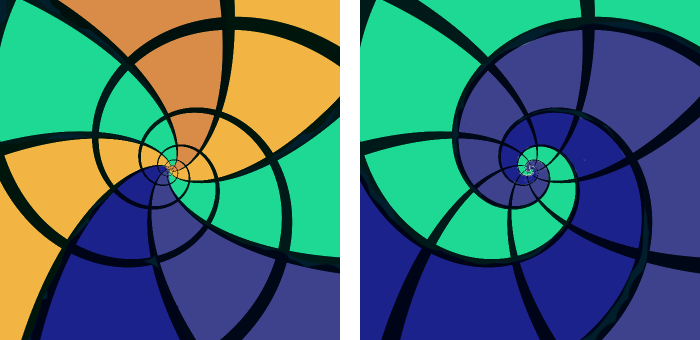
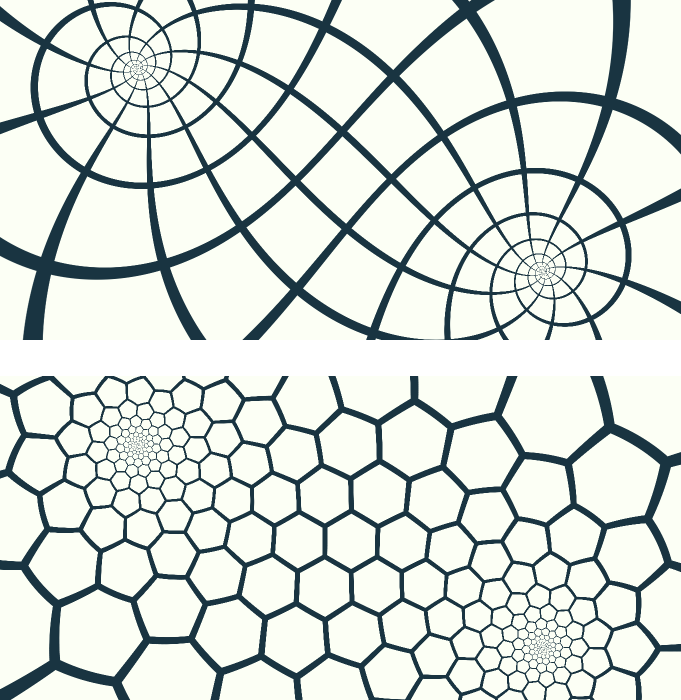
These are beautiful and fascinating functions. I don’t want to get too deep into their mathematical properties here, so I’ll say intuitively that a Möbius transformation can exchange a point at infinity with another point. If I pass a tiling through one of these transformations, I can grab infinitely many tiles that are arbitrarily far away and pack them into a point that looks like the centres of the spirals you’ve already seen. Better yet, I can keep the spiral centre I’ve already got, giving me a picture with two infinities! Here are two examples, one based on squares and one based on hexagons.
Again, this isn’t a new idea. Escher experimented with it in his print Whirlpools, and others such as Jos Leys have created similar designs.
By the way, it’s very tempting to try to repeat this trick and drag a third infinity into the picture. Sadly, that simply doesn’t work. Can you see why?
Try it Yourself!
If you’ve read this far (or even if you haven’t), now you have a chance to play with all of these ideas yourself.
Last year I released Tactile, a library for C++ and Javascript that makes it easy to write programs to manipulate and draw tilings. Part of my motivation in creating the library was that it would then be easier for me to write quick pieces of software to demonstrate or exploit ideas from tiling theory. And that’s what I’ve done here! I wrote a fun web-based editing tool that lets you draw tilings and experiment with transforming them into spirals. Tactile is based on isohedral tilings; happily, these are all periodic, and so they’re perfect for experimentation in spiral form.
Click here to launch the tool in a new window. It’s written to be usable from a touch device like a tablet (though I wouldn’t expect it to be usable on a small phone), but it will work fine with a mouse too. The many features deserve some elaboration. I explain the different controls below, using this annotated screen shot as a guide.
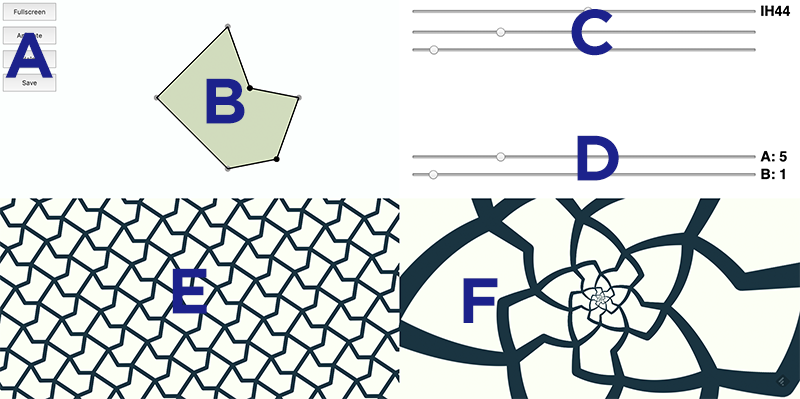
- There are four buttons. The “Fullscreen” button makes the spiral tiling take up the whole window. You can return to the full interface by tapping the button again. The “Animate” button moves the untransformed tiling automatically, making the spiral mapping rotate and scale. The “Help!” button brings you to this post (in case you found the tool without reading this post first). The “Save” button downloads the spiral tiling from your browser.
- This view lets you edit the shape of a single tile. Tap on a black edge to create a new vertex and drag it around. Long-press on a vertex to delete it. The grey vertices cannot be moved directly.
- Controls for the structure of the tiling. The top slider lets you choose a tiling type. There are 81 types encompassing triangles, squares, hexagons, and other base shapes. Each type uses a different number of additional sliders to control the arrangement of grey vertices on the left. Moving those sliders will change the overall configuration of the vertices.
- These two sliders are precisely the values of and discussed above, controlling the vector that will be mapped to cover the horizontal slice. You can actually set them both to zero; the program won’t crash, but it won’t draw anything.
- The regular Euclidean tiling. You can translate the tiling around by clicking and dragging, and see the effect on the spiral view. Horizontal and vertical translation map to uniform scaling and rotation, respectively.
- A view of the resulting spiral tiling. Tap on the view to switch between a regular antiMercator mapping with one infinity, and a Möbius transformed picture with two infinities.
Conclusion
The combination of the complex exponential function and suitable transformations of periodic tilings offers a vast playground for creating beautiful and fun spiral tilings.
Wow, this post ended up longer than I had planned. I hope the diagrams and pretty pictures helped it go down smoothly! For my part, this post and the accompanying software were at least in part a distraction from an upcoming grant deadline. Thanks for validating my brief escape from professional duties.
Leave a Reply